
Every article we publish covering logistics and supply chain KPIs piques our website visitors’ interest and receives a wealth of positive feedback. In addition, those articles inevitably stimulate readers to post questions, which, over time, we try to answer in detail by creating new blog posts to address them.
As we are often asked about KPIs for inventory management, that’s what we’re going to focus on in this particular post.
After reading, you will be better informed about the most appropriate KPIs for IM and know the more commonly used ones. You will also understand their notable benefits to the inventory management discipline.
10 Invaluable KPIs to Track Inventory Management Performance
The following KPIs comprise those commonly used across all warehouse operation types, along with some that are less ubiquitous but which your business might benefit from monitoring.
The one thing they all have in common is that, under the right circumstances, they are more than merely valuable metrics. With the ability to provide valuable clues about what you’re doing right and where you can improve your inventory management, each one deserves its designation as a key performance indicator.
1: Inventory Turns

Every company that depends on selling a physical product needs to know how fast the product moves. The inventory turns KPI is the metric that provides this information. Before you can calculate inventory turns, though, there are two things you first need to know.
You need to know the cost of goods sold (COGS) for the period over which you want to measure inventory turns, and you need to know the average inventory held for that same measurement period, which would typically be a month or a year.
You will probably get the former value from your company’s income statement. To calculate the average inventory, you must take the value of inventory held at the start of the measurement period, the value of inventory held at the end of the period, and add them together—then divide the total by two.
Finally, you will get the inventory turn ratio by taking the COGS and dividing it by the average inventory.
Inventory Turns: An Illustrative Example
Here’s an example of the total calculation of inventory turns:
Company A has COGS of $315 million for the year 2020. At the start of the year, inventory value was $47 million and at the end of the year was $46.2 million. The calculation looks like this:
$315 million ÷ ($47 million + $46.2 million)/2 = 6.76
Therefore, Company A’s inventory turn ratio is 6.76.
In most cases, you would want to see this ratio increase over time, since generally, a high ratio bodes well for profitability. That’s because the faster you sell your inventory, the lower your company’s holding costs such as utilities, rent, insurance, shrinkage, and other related expenditure.
Assuming the price for which you sell your products remains consistent, reduced holding costs driven by increasing inventory turns, will bring you greater profits.
2: Days Inventory or Days Sales of Inventory

Once you’ve arrived at your inventory turn ratio, it’s merely one small step further to understand how many days it takes to turn over (sell) your entire inventory.
Days inventory is another crucial indicator of inventory management performance and highlights the speed at which your company is turning goods into cash. As you might expect, a reduction in days inventory typically represents a performance improvement.
To arrive at the days inventory value for your company, you take the number of days in the measurement period and divide it by the turn ratio.
So to return to Company A in the previous example, the calculation would be as follows:
365/6.76 = 53.99
Therefore, Company A turns its inventory over in 54 days on average. Of course, whether that figure is good or bad depends on its products’ nature and characteristics. Nevertheless, any improvement efforts would focus on bringing the days inventory down.
You can also similarly monitor weeks inventory, using 52 as the number to divide by the turn ratio.
3: Inventory Accuracy

The problems arising from inaccurate inventory records are many. They are varied. And they are always undesirable. When accuracy is lacking, so is the ability to forecast, plan, sell, and fulfill, and customer dissatisfaction is sure to follow.
If you wish to prevent the negative consequences of inaccuracy, it is essential to test and monitor how effectively your physical inventory matches what’s recorded in your stock book.
Presumably, your company will be using an ERP, WMS, IM, or similar business information system to keep track of your inventory. Consequently, you will need to know when and where discrepancies arise between the data and the physical stock.
The only way to meet that objective is to perform regular inventory counts to check that what’s on your warehouse floor is a precise match for what your system tells you is there. That doesn’t mean merely that the quantities should correspond. The storage locations and batch/serial numbers on record should also tally precisely with the physical stock.
How to Calculate Inventory Accuracy
The most practical inventory accuracy approach is to use cycle counting so that you regularly check a representative portion of your total inventory. Your cycle counts will allow you to measure what percentage of your stock matches with your records and that you can hence classify as “accurate.”
To arrive at that percentage, you will utilise the following formula:
(Number of units on record / number of units counted) x 100.
So, in the case of our now familiar Company A, we might illustrate the inventory accuracy formula with the following example:
Company A performs a cycle count and physically counts 3290 units. In checking the electronic records, the team finds that 3174 units perfectly match the physical stock. Those units match in every way, as in physical presence, batch numbers, and bin numbers.
The other 116 units do not match. In the case of these 116 items, the system and the physical items show different batch numbers or storage locations.
Therefore, 3174/3290 = 0.964 x 100 = 96.4%.
Company A returns an inventory accuracy of 96.4% for that particular cycle count. Is that satisfactory? Most inventory managers would consider it borderline inadequate and would start looking for the root causes of the discrepancies and seeking solutions. Inventory accuracy of 97% should probably be deemed the barest minimum, with targets ideally closer to 100%.
4: Inventory to Sales Ratio
As we’ve already seen, the key to healthy profits is to turn inventory as quickly as possible. The inventory to sales ratio is another helpful KPI to track turnover. You can choose the periods over which you monitor inventory to sales ratio. Many inventory-conscious companies monitor it annually, quarterly, monthly, and perhaps weekly.
In any case, to arrive at the ratio, you take your average inventory for the period by adding together the inventory totals at the beginning and end of that period, then dividing the sum by two. Then you must divide the average inventory by the net sales value for the period.
How would this look for Company A?
For simplicity, let’s assume that the company manufactures just one item—and sells it for $23 per unit.
Now let’s assume that the average inventory for last week was $230,000, and that 15,000 of the units were sold, with 108 returned for various reasons. That makes a net sales value of $342,516.
Therefore…
230,000 / 342,516 = 0.67.
So Company A had an inventory to sales ratio of 0.67 last week. That’s not an ideal result, so the company should look to improve. A good ratio would be somewhere between 0.17 and 0.25.
5: Dead Inventory
No business wants to experience dead inventory scenarios, but most will do so at some time or another, especially those that trade in perishable products. Some inventory inevitably goes over-age or just stops moving and sits in warehouse racking, at which point it is effectively dead.
The point at which your inventory might be considered dead is yours to determine, but it is essential to define that point and keep track of the unsellable percentage of stock.

As with other KPIs, you can choose whether to track dead inventory monthly, quarterly, or annually. Whichever period you choose, the formula is as follows:
(Amount of dead inventory in the period / amount of available stock in the period) x 100.
Naturally, you want the percentage of dead inventory to be as low as possible. However, if the rate should rise to anywhere near 25%, or god forbid, above that, drastic measures will be necessary to ensure your business remains competitive.
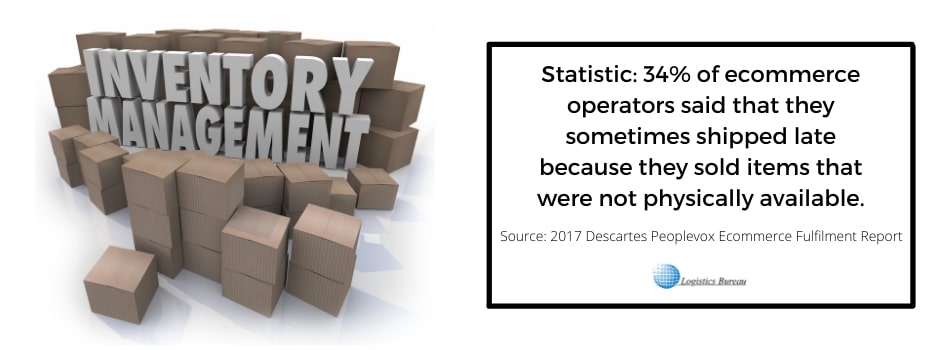
6: Out of Stock Items
The first five KPIs that we’ve looked at concern physical characteristics of inventory, such as how much there is and how fast it’s moving. At the same time, it’s also necessary to keep an eye on service provision as an indicator of inventory management performance.
While some service elements, like late delivery or picking accuracy, are not directly connected to the inventory itself, others, such as out-of-stocks and backorders, are.
Out of Stock items is a critical performance measurement for inventory managers since customer satisfaction depends on holding the correct quantity of inventory and replenishing it at the right times.

Measured as a percentage of total inventory, the out of stock items KPI formula is straightforward, and looks like this:
(Number of items out of stock / Number of items shipped) x 100.
7: Backorder Rate
Closely related to the measurement of out-of-stock items, the backorder rate works slightly differently. Rather than just indicating the percentage of items that are out of stock, this KPI measures the percentage of customer orders that cannot be filled at the time they are placed.
Here is the formula for calculating backorder rate:
(Number of orders delayed due to items on backorder / total number of orders placed) x 100.
Depending on the nature of your business, a low percentage of backorders, even if regularly occurring, might not be a bad thing. That said, if the rate is too high, so is the risk of losing valuable business.
8: Demand Forecast Accuracy
This KPI is a big deal because so many elements of sales success depend on accurate forecasts of demand. Supplier lead times, inventory levels, customer satisfaction, and revenue are all sensitive to forecast accuracy. The only way to improve it is to measure how and why your actual demand deviates from your forecasts.
Of course, you can only measure the accuracy of your forecast after the end of the forecast period. The simplest approach is to subtract the forecast demand from the actual demand, divide the result by the actual demand, and multiply by 100. The formula looks like this:
[(actual demand – forecast demand) / actual demand] x 100.
In the case of Company A then, if actual demand for a given period was 15,000 units, and the forecast demand was for 12,250 units, the result would be as follows:
[(15,000 – 12,250) / 15,000] x 100 = 18.33.
Therefore the company experienced a deviation of 18.33% between actual and forecast demand. In other words, forecast accuracy was 81.67%.
The likelihood of ever consistently achieving 100% forecast accuracy is minimal. Nevertheless, 100% is a valid target for which to aim, since the closer you get, the better.
9: Inventory Carrying Cost
Earlier in this post, we touched on the cost of holding inventory, mentioning that the slower your stock turns, the more those costs will be. Consequently, it makes sense to know the precise tally of those expenses. That’s why the inventory carrying cost KPI is another favorite metric of inventory managers.
Inventory carrying cost comprises four components. They are:
- Capital costs – the value invested in the inventory itself
- Service costs – tax, insurance, and IT costs
- Storage costs – fixed and variable costs of the warehouse that stores the inventory
- Risk costs – inventory shrinkage and value depletion
After adding these costs together, the total value becomes the inventory holding sum. To calculate your inventory carrying cost, you will take this sum and divide it by the total value of your inventory, then multiply the result by 100, as in the following example:
Inventory holding sum = $15,000,000
Total value of inventory = $50,000,000
In this example, the inventory carrying cost is (15,000,000 / 50,000,000) x100 = 30. Hence, it’s 30% of the total inventory value.
If this was the outcome for Company A, the management team should be looking for some remedies to reduce it, because 30% is at the upper limit of what might be considered acceptable, in most cases. A target of 20% would be a reasonable initial objective, or 15%, while considerably more ambitious, might not be impossible to achieve—and would make a substantial difference to the company’s profitability.
10: Labour Cost per Item

You might find that rather than calculating only the overall carrying cost of your inventory, you’d like to break out certain cost elements so that you can focus on their optimisation.
For example, the warehouse labor cost might be an excellent target. That’s one cost aspect in which hidden opportunities for reduction often lie, not to mention the reality that labour expenditure makes up a large portion of inventory carrying costs.
You can’t beat the labor cost per item metric when you need a clear picture of labor expenditure. It will show you how much it costs your company in labour to produce and supply a single unit of a specific product.
You can measure this cost by function or business unit. For instance, your warehouse management team might want to see the costs per unit for the warehouse network—or even a single warehouse.
On the other hand, if your company is a producer or manufacturer, you will naturally want to monitor the labour costs involved in the manufacturing process. At the highest level, you can calculate the total cost of labour for the movement of one item through the entire supply chain.
How to Determine Labour Cost per Item
To calculate the labour cost per item, you should first determine the periodic span for your measurement. For example, will you track it weekly, monthly, quarterly, or annually?
Once determined, you then take the total labour expenditure for that period and divide it by the total number of units produced or handled. The result is the sum of labour expenses per unit. To illustrate the formula with a practical example, let’s return one last time to Company A.
We’ll assume that Company A’s total labour expenditure for a hypothetical period was $7,500, and that it produced and handled 15,000 units. Therefore…
$7,500 / 15,000 = $0.50 per unit. Hence the company’s labour cost was $0.50 per item.
With knowledge of the labour cost per item, your management team can start looking at opportunities to reduce it, which essentially means implementing changes to raise workforce productivity.
Inventory Management KPIs: Not Just for Warehouse Teams
The ten KPIs presented in this article are among the most useful to deploy in any business with inventory to manage. Indeed, they will all enhance the visibility of performance for warehouse and logistics teams when integrated with operational warehouse management metrics in a business intelligence dashboard.
However, unlike the warehouse management KPIs we presented in our recent article dedicated to that topic, inventory management KPIs are of value to a broader range of stakeholders.
Procurement and purchasing functions, resource and production planners, and even sales departments can all play a role in IM performance along with the fulfillment team, so they should probably include a select few of these KPIs in their performance metrics suites.
Need a Little Help with Inventory Management KPIs?
Given the substantial sums of money that your company probably invests in purchasing, storing, moving, and selling inventory, it would be shameful to neglect management performance tracking. However, effective measurement is all about having the right KPIs in place.
Have you already implemented some of those described in the previous paragraphs in your supply chain operation? If you have, you’ll be well on your way towards exemplary, rather than merely adequate, inventory management performance.
Would you like some practical help with selecting, deploying, or using inventory management KPIs to enhance performance in your enterprise? If so, please reach out to us because our experts are ready and waiting to work with you and your management team.
You can book a FREE initial consultation with one of our specialists RIGHT NOW! It just takes a few moments to complete our painless online reservation process… Or, of course, you can contact us directly by phone or email anytime.
Editor’s Note: The content of this article was originally published on Logistics Bureau’s website dated December 21, 2021, under the title “A Concise Guide to Inventory KPIs for Your Business“.